SHAREHOLDER INFORMATION
This annual report should be read in conjunction with Newell Rubbermaid's 2015 annual meeting proxy statement and the 2014 Form 10-K. Copies of the proxy statement and Form 10-K may be obtained online at www.newellrubbermaid.com.
Additional copies of this annual report, Newell Rubbermaid's Form
10-K and proxy statement filed with the Securities and Exchange Commission, dividend reinvestment plan information, financial data and other information about Newell Rubbermaid are available without charge upon request.
CONTACT INFORMATION
All requests and inquiries should be directed to:
Newell Rubbermaid Inc.
Investor Relations
3 Glenlake Parkway
Atlanta, GA 30328
(800) 424-1941
investor.relations@newellco.com
www.newellrubbermaid.com
ANNUAL MEETING OF STOCKHOLDERS
The annual meeting of stockholders will be held on May 12, 2015, at 9:00 a.m. ET at:
Newell Rubbermaid Inc.
Corporate Headquarters
3 Glenlake Parkway
Atlanta, GA 30328
Phone: (770) 418-7000
STOCKHOLDER ACCOUNT MAINTENANCE
Communications concerning the transfer of shares, lost certificates, dividends, dividend reinvestment, duplicate mailings or change of address should be directed to the Transfer Agent and Registrar:
Computershare
P.O. Box 30170
College Station, TX 77842-3170
(877) 233-3006
(312) 360-5217
www.computershare.com/investor
MARKET FOR REGISTRANT’S COMMON EQUITY AND RELATED STOCKHOLDER MATTERS
The company’s common stock is listed on the New York Stock Exchange (symbol: NWL). As of January 31, 2015, there were 10,872 stockholders of record. The following table sets forth the high and low sales prices of the common stock on the New York Stock Exchange Composite Tape for the calendar periods indicated:
| 2014 | 2013 | |
| Quarters |
High
Low
|
High
Low
|
| First |
$
32.54
$
29.14
|
$
26.11
$
21.72
|
| Second |
31.61
28.27
|
28.47
24.90
|
| Third |
35.25
30.85
|
27.97
24.32
|
| Fourth |
38.73
31.14
|
32.54
26.29
|
The company has paid regular cash dividends on its common stock since 1947. For 2014, the company paid a quarterly cash dividend of $0.15 per share in the first quarter and $0.17 per share in each of the second, third and fourth quarters. For 2013, the company paid a quarterly cash dividend of $0.15 per share. The payment of dividends to holders of the company’s common stock remains at the discretion of the Board of Directors and will depend upon many factors, including the company’s financial condition, earnings, legal requirements and other factors the Board of Directors deems relevant.
In February 2015, the company’s Board of Directors approved a 12 percent increase in the quarterly dividend from $0.17 per share to $0.19 per share, effective with the quarterly dividend payable in March 2015.
FORWARD-LOOKING STATEMENT
We discuss expectations regarding future performance, events and outcomes, such as our business outlook and objectives, in this annual report. All such statements are “forward-looking statements,” and are based on financial data and business plans available as of the date of this annual report, which may become out-of-date or incomplete. We assume no obligation to update any forward-looking statements as a result of new information, future events or other factors. Forward-looking statements are inherently uncertain and investors must recognize that actual results could be significantly different from our expectations. Risks and uncertainties that could cause results to differ from expectations are detailed in Item 1A of Newell Rubbermaid’s Annual Report on Form 10-K for the year ended December 31, 2014, and in our other filings with the Securities and Exchange Commission.
NON-GAAP FINANCIAL MEASURES
This report contains non-GAAP financial measures within the meaning of Regulation G promulgated by the Securities and Exchange Commission and includes a reconciliation of these non-GAAP financial measures to the most directly comparable financial measures calculated in accordance with GAAP. While the company believes that these non-GAAP financial measures are useful in evaluating the company’s performance, this information should be considered as supplemental in nature and not as a substitute for or superior to the related financial information prepared in accordance with GAAP. Additionally, these non-GAAP financial measures may differ from similar measures presented by the other companies.
COMMON STOCK PRICE PERFORMANCE GRAPH
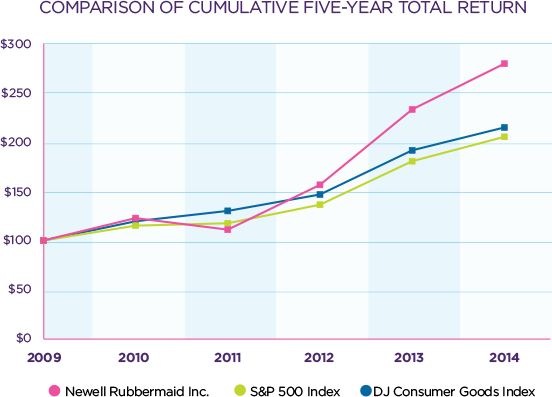
The following common stock price performance graph compares the yearly change in the company’s cumulative total stockholder returns on its common stock during the years 2010 through 2014 with the cumulative total return of the Standard & Poor’s 500 Index and the Dow Jones Consumer Goods Index, assuming an investment of $100 on December 31, 2009, and the reinvestment of dividends.

| 2009 | 2010 | 2011 | 2012 | 2013 | 2014 | |
| Newell Rubbermaid Inc. | $100 | $122.70 | $110.98 | $156.47 | $232.96 | $279.37 |
| S&P 500 Index | $100 | $115.06 | $117.49 | $136.30 | $180.44 | $205.14 |
| DJ Consumer Goods Index | $100 | $119.50 | $130.01 | $146.66 | $191.47 | $214.65 |
